Performance and Core Web Vitals
The Performance page measures real Core Web Vitals (PageSpeed Insights), shows real-user CrUX data, per-page Lighthouse diagnostics and generates the development ticket.
The Performance page (sidebar Site Audit → Performance) measures your site’s real speed with Google’s Core Web Vitals and turns the diagnostics into actionable guidance for the developer. It’s powered by the SEO audit: each scan samples some pages and measures their performance; while an audit is running, the page shows the progress in real time. The report’s Core Web Vitals tab shows only the summary table, with a button to open this page.
Plan required: included with SEO Audit from the Solo plan upwards. Development ticket generation has a separate monthly budget (see the table below).
How Core Web Vitals are measured
The data are real Google PageSpeed Insights (mobile Lighthouse) measurements, not estimates: each audit samples the homepage + one page per type/path, up to the plan’s cap, and measures Performance score, CLS, LCP and TBT for each.
| Plan | Sampled pages per audit |
|---|---|
| Solo | 3 |
| Starter | 5 |
| Pro | 10 |
| Agency | 20 |
What each column measures, and the thresholds the app colours them with (green = good, yellow = needs improvement, red = poor):
| Metric | What it measures | Good | Poor |
|---|---|---|---|
| Performance score | Overall Lighthouse score (0-100) | ≥ 90 | < 50 |
| LCP — Largest Contentful Paint | Render time of the largest visible element | ≤ 2500 ms | > 4000 ms |
| CLS — Cumulative Layout Shift | How much elements shift during loading | ≤ 0.1 | > 0.25 |
| TBT — Total Blocking Time | How long the main thread stays blocked and unresponsive to input | ≤ 200 ms | > 600 ms |
| INP — Interaction to Next Paint | Responsiveness to real input (CrUX card only) | ≤ 200 ms | > 500 ms |
| TTFB — Time To First Byte | How long the server takes to respond (LCP diagnosis column) | ≤ 600 ms | above: hosting/caching |
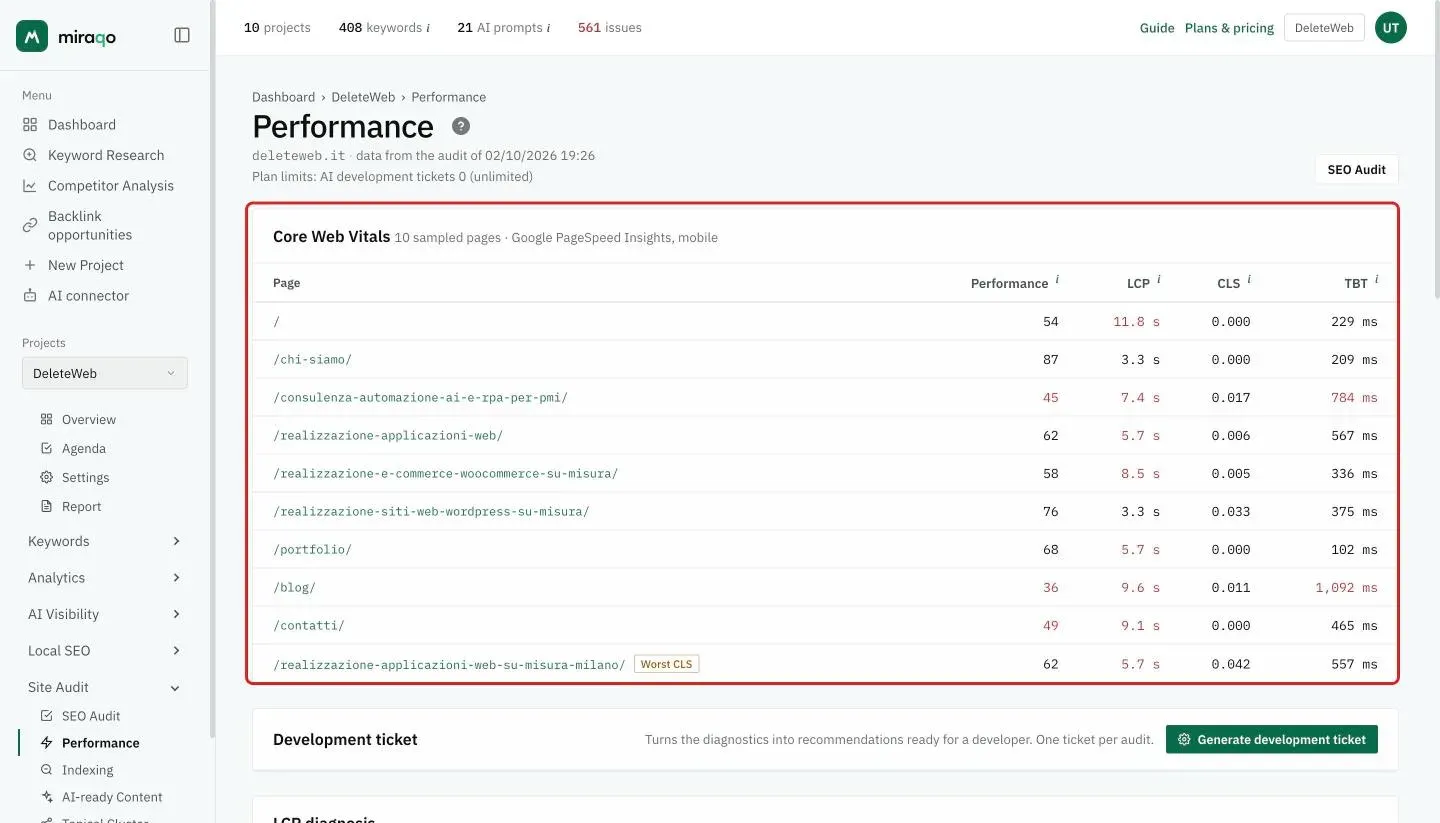
Lighthouse scores can vary between audits even when the site is unchanged (by up to 20–30%): that’s the normal variability of lab tests, documented by Google. Look at the trend across audits, not the single number.
Real user experience (Chrome UX Report)
If the site has enough traffic, a card appears with CrUX data: LCP, INP and CLS at the 75th percentile, measured on real Chrome visitors over the last 28 days, with a Good / Needs improvement / Poor verdict. Unlike Lighthouse scores they’re stable, and they’re what Google uses for ranking. The “whole site” badge means the individual page doesn’t have enough traffic and the data refers to the whole domain.
Per-page Lighthouse diagnostics
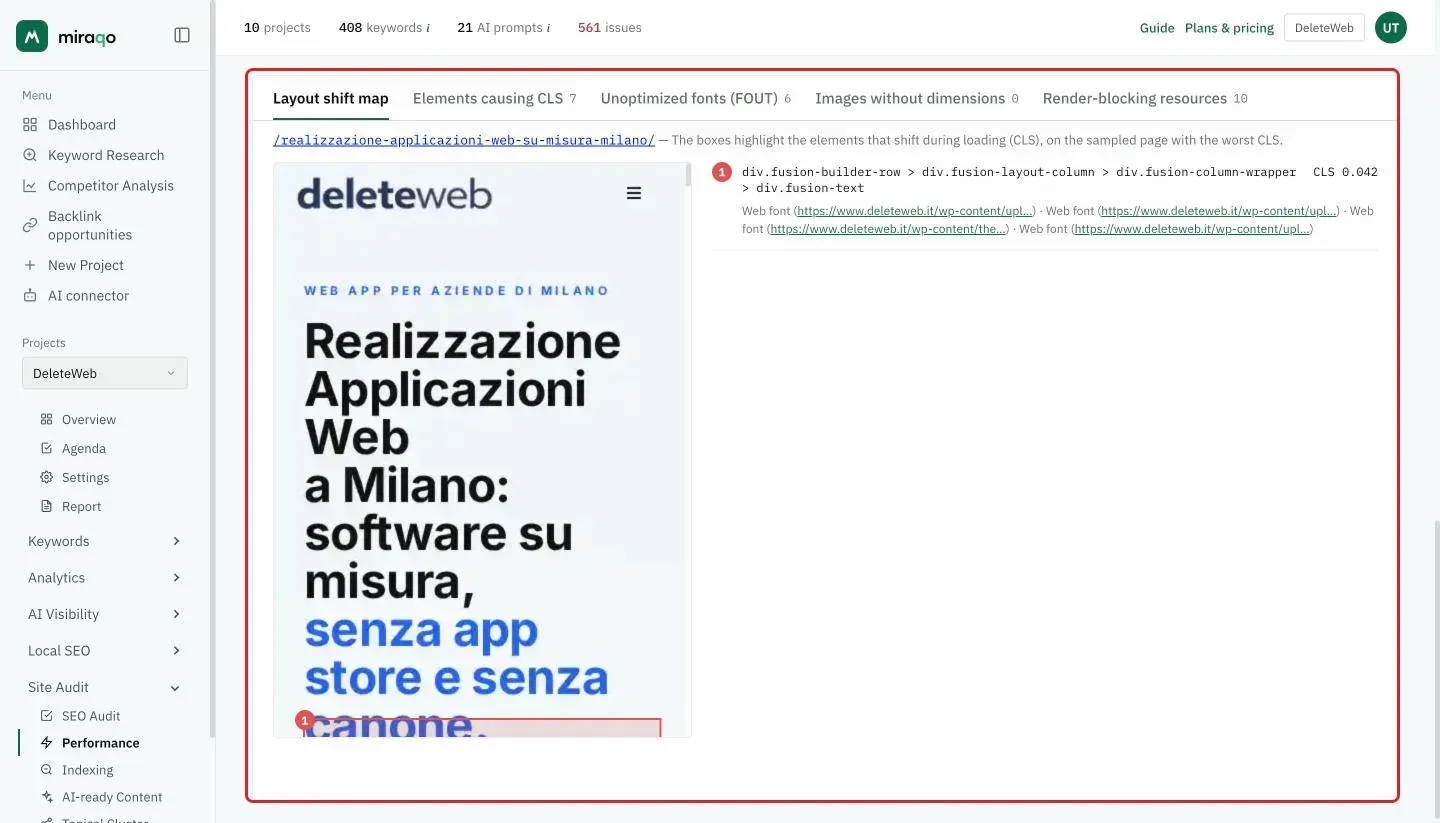
Below the metrics you’ll find the LCP diagnosis and, at the bottom, Lighthouse’s raw diagnostics split into tabs: Layout shift map (screenshot of the sampled page with the most displayable shifts, with boxes over the elements that shift during loading — a dashed border around the whole page indicates a global reflow, e.g. from web fonts, with the cause zones highlighted solid), Elements causing CLS with a Cause column (unsized image, web font, injected iframe — labels in English, as Lighthouse provides them), Unoptimized fonts (FOUT), Images without dimensions and Render-blocking resources. Next to each tab name is its number of rows.
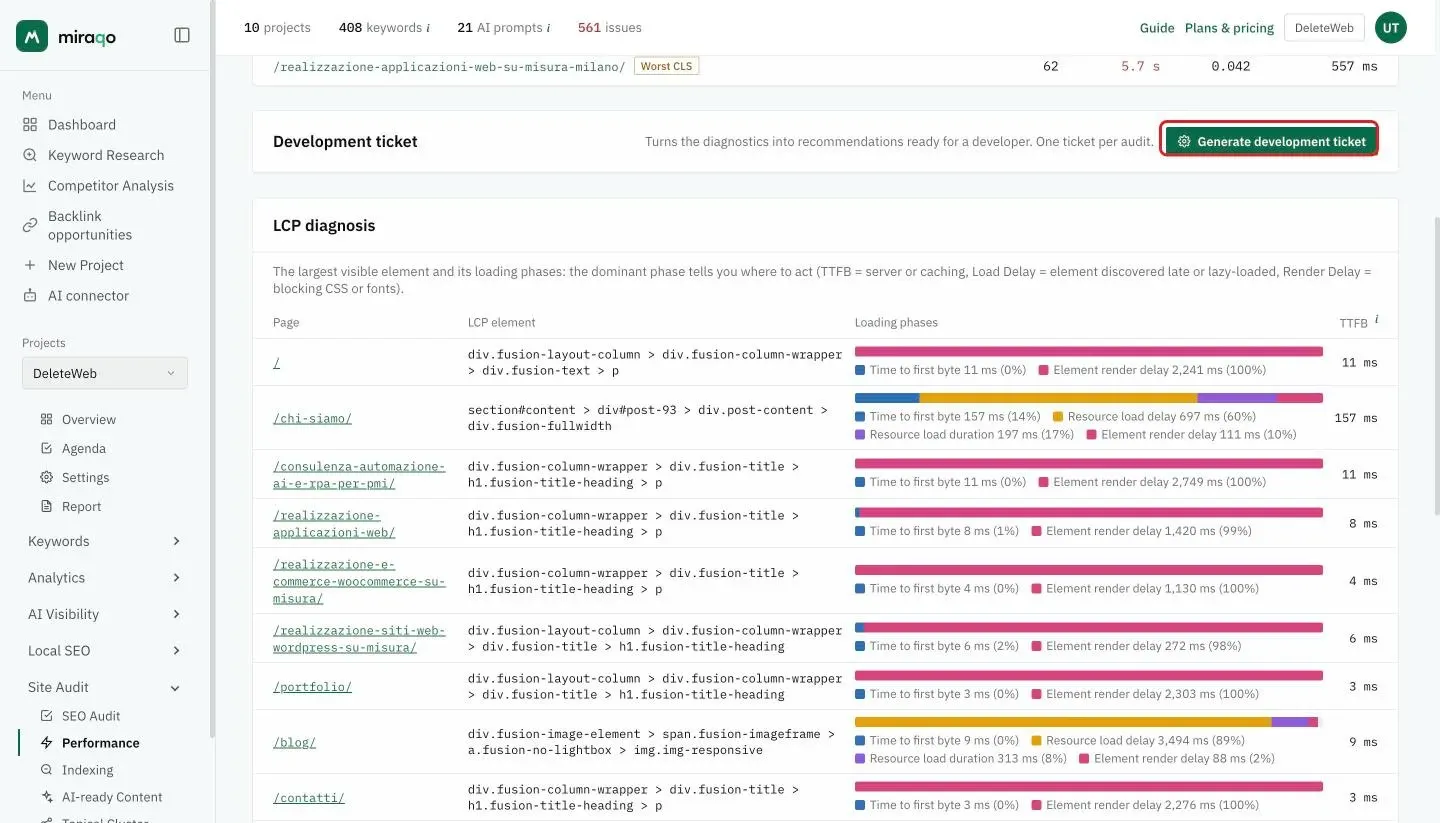
The LCP diagnosis table shows, for each sampled page, which element is the largest visible one (the one that determines LCP), its loading phases — the dominant phase tells you where to act: high TTFB = server or caching, Load Delay = element discovered late or lazy-loaded, Render Delay = blocking CSS or fonts — and the server response time. It only appears for audits started after the feature was enabled: if you don’t see it, run a new audit.
Unoptimized fonts (FOUT) lists the web fonts that cause a Flash of Unstyled Text: the page first shows the text in a fallback font and then swaps it when the web font arrives, with a visible jump that can also count as a layout shift. It’s usually fixed by adding font-display: swap and a preload for the font, or serving it from the same domain.
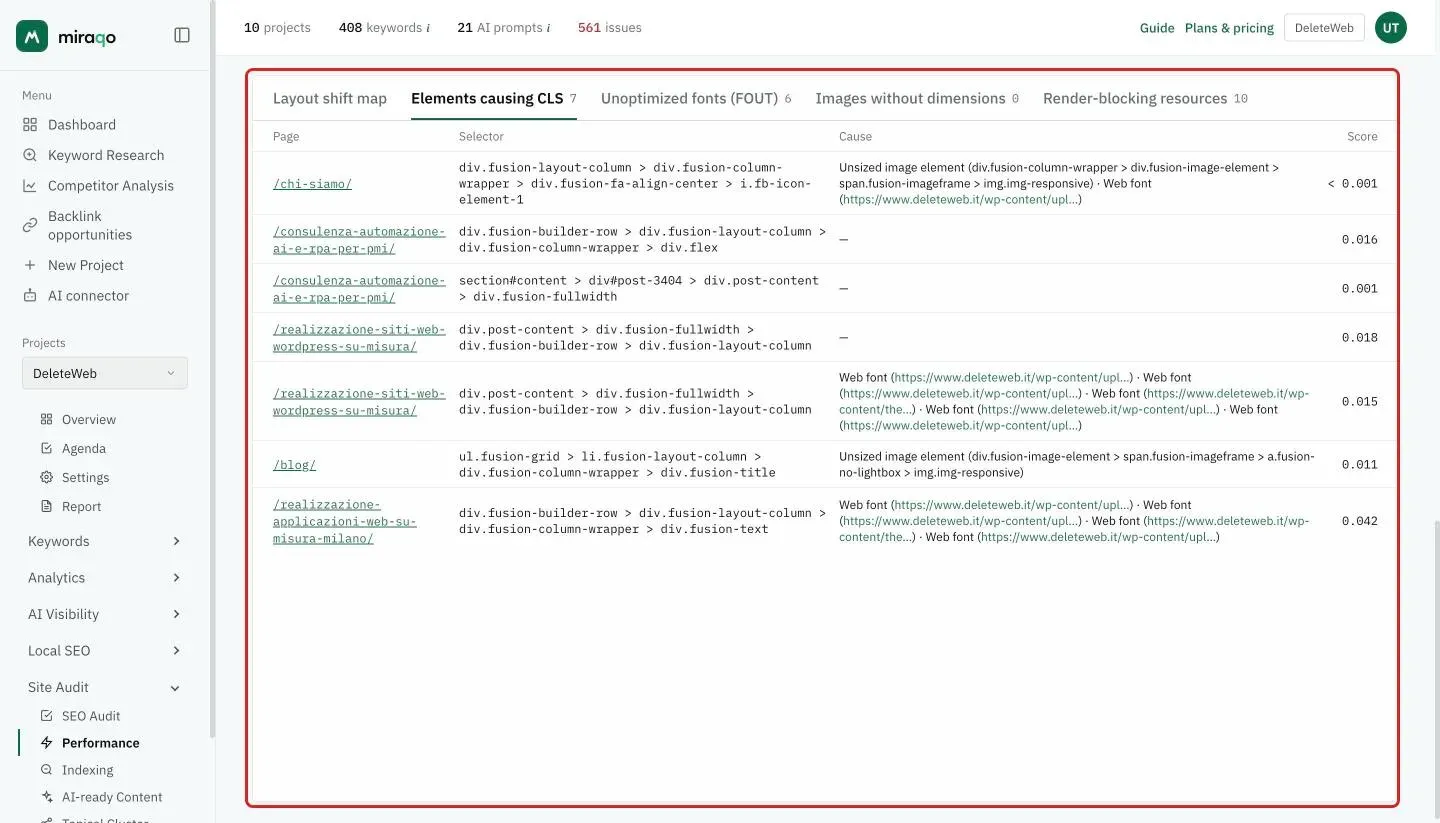
An empty table isn’t an error. The CLS value and the “elements causing CLS” list come from two independent Lighthouse mechanisms: a high CLS with no elements listed is normal, typically on pages with third-party widgets/comments/embeds that Lighthouse can’t attribute to a specific node. Likewise, empty tables for images without dimensions or render-blocking resources just mean Lighthouse didn’t detect any on that sample.
Generate development ticket
Generate development ticket turns the diagnostics into a plain-language ticket for each sampled page, ready to hand to a developer. The ticket opens with the root cause inferred from the loading phases and cross-references the Lighthouse data with the page’s actual HTML: it names the exact files and attributes to change (for example a loading=lazy to remove from the main image, or a missing preload) and tailors the advice to the detected platform, such as the installed WordPress theme or plugins. It’s on-demand but generated once per audit (re-enabled by re-running the audit), with a monthly budget separate from the page sampling — the counter is visible below the Performance page title and in Subscription:
| Plan | AI Core Web Vitals tickets / month |
|---|---|
| Solo | 4 |
| Starter | 13 |
| Pro | 40 |
| Agency | 200 |
Want to review the full technical report? Back to Run your first SEO audit →
Last updated: 18 October 2026