Connect Google Search Console to your project
How to connect Google Search Console to the project and read the GSC Data page — metric cards with activatable chart series, 6 tabs (Queries, Pages, Countries, Devices, Dates, Appearance), period filters and manual sync.
Connecting Google Search Console is optional but strongly recommended. It gives you access to Google’s real data on your impressions, clicks and CTR — information Miraqo uses to:
- Show estimated organic traffic for each keyword
- Suggest new keywords (queries that already bring impressions but aren’t yet tracked, see Project keywords)
- Distinguish the “average position” shown by Google from pure ranking
GSC measures how Google sees your site (impressions, clicks, position). For real traffic on the site (sessions, users, conversions) there’s a separate and complementary integration: Google Analytics 4 or Matomo.
Prerequisites
- Site already verified in Google Search Console (with the Google account you’ll use for the connection)
- Access permission to the site’s GSC data (owner or delegated user)
If the site isn’t verified in GSC yet, do that step first on the Google portal. Miraqo can’t add or verify a new site in GSC — it can only read data from already-verified sites.
Connection procedure
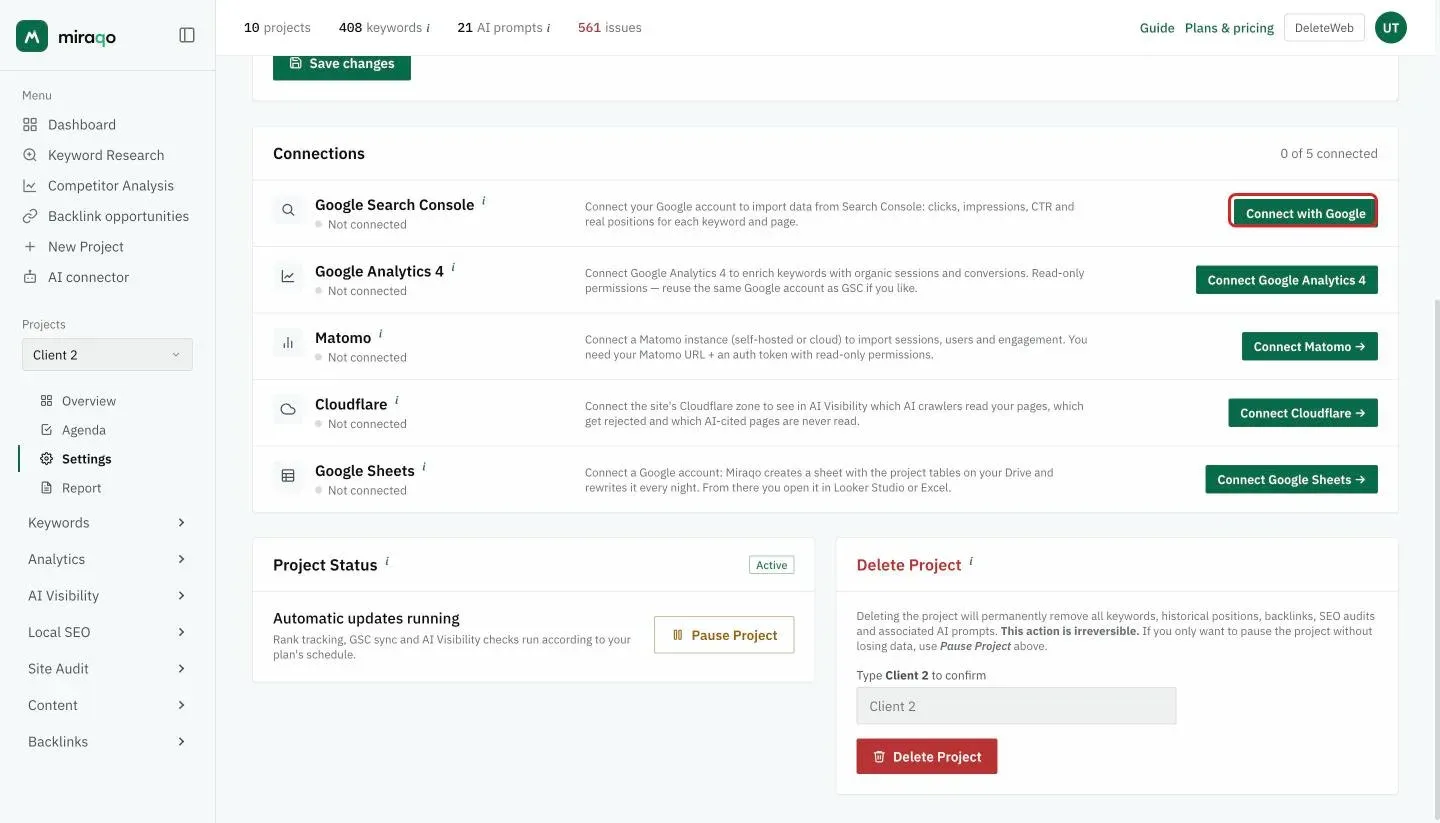
- Open the project → Settings → General. In the Connections card the first row is Google Search Console.
- Click Connect with Google.
- You’re redirected to Google: choose the account with GSC access and click Continue.
- Grant the requested permissions (read-only: Miraqo writes nothing to GSC).
- Back on Miraqo with the message “Google Search Console connected! Found N properties”. If the project domain matches one GSC property, it’s selected automatically. Otherwise choose the right one from the GSC property in use dropdown (
https://example.com/vssc-domain:example.com) and click Save.
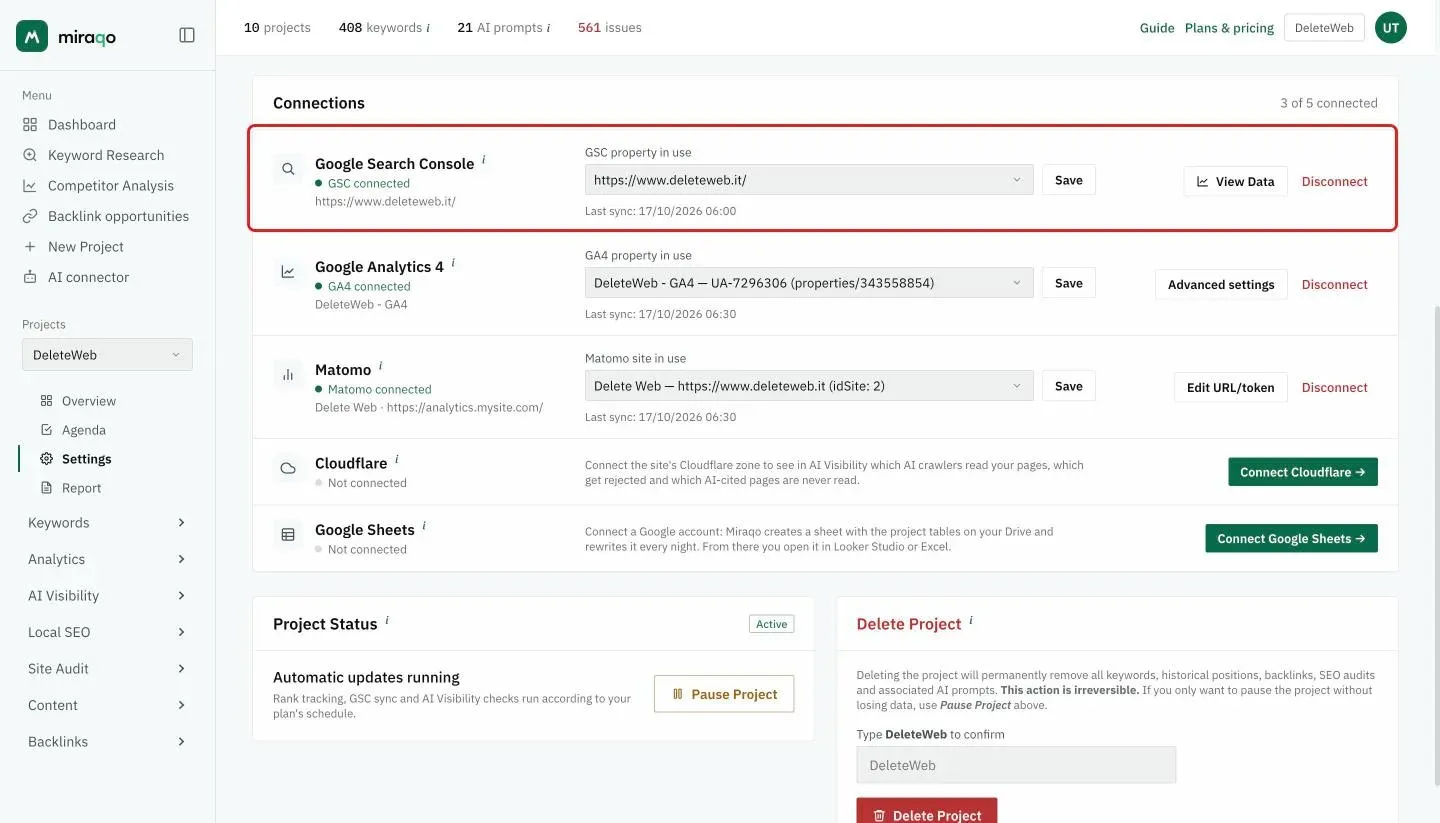
The first sync starts automatically and imports the last 90 days of data. For projects with many queries it may take 1–2 minutes. Below the menu, the row shows the date and time of the last sync.
Changing property after connecting: from the same Settings row, if you have multiple properties available on the account, you can change the property used from the dropdown without having to reconnect. The View Data button goes straight to the GSC Data page.
The GSC Data page
Reach it from the project sidebar → Google Search Console.
Header and actions
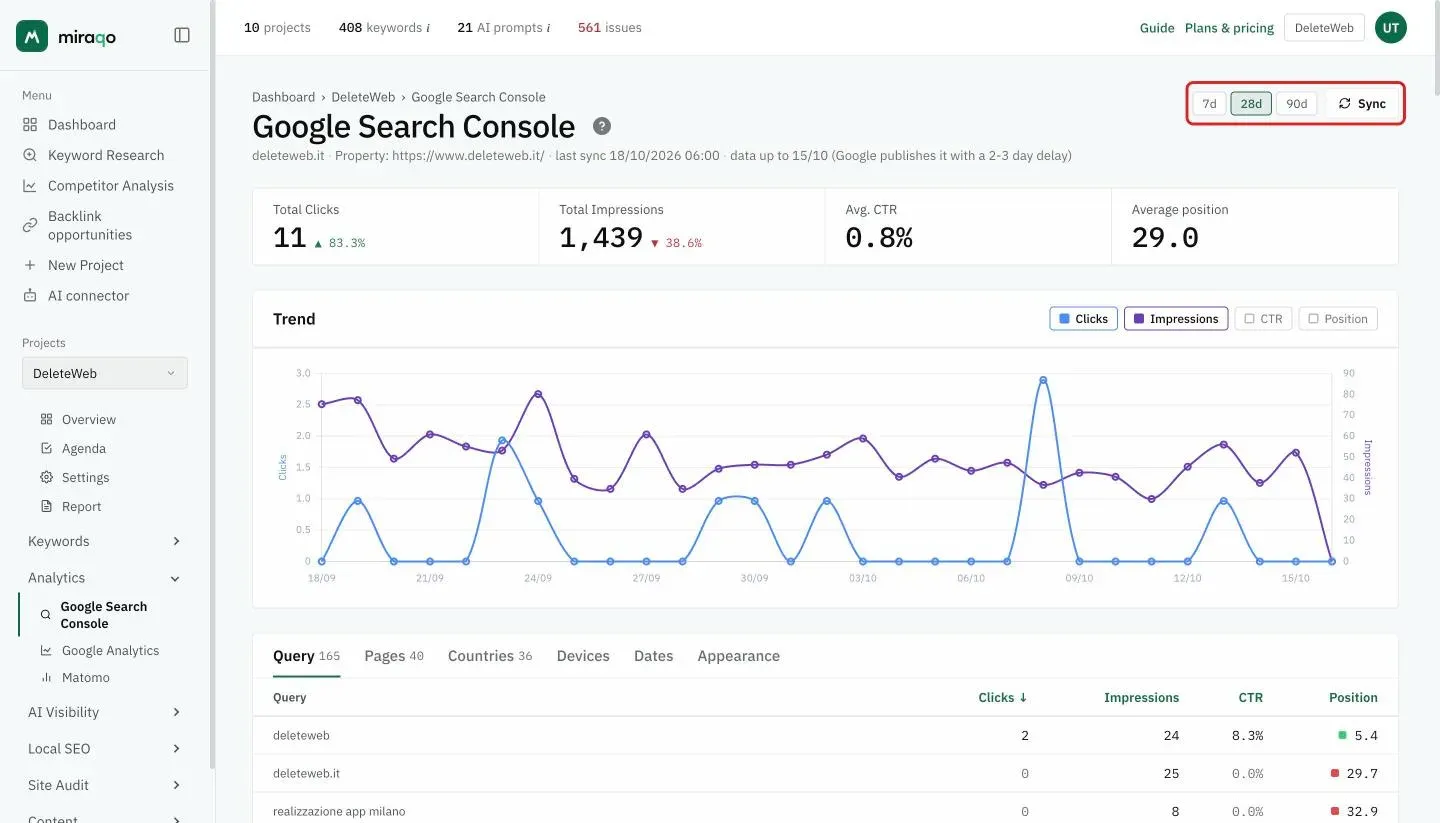
- Title “Google Search Console”; below it, the domain, the property, the time of the last sync and the date the data reaches (Google publishes it with a 2–3 day delay)
- Top right, the period — 7d / 28d / 90d to choose the interval; changes the entire page and tables
- Next to it, Sync — forces a new data fetch (for roles with sync permission)
Possible states before data
- GSC not connected — empty state with “Go to Settings” button
- Connected but no property selected — notice with Settings button
- No data synced yet — empty state with “Sync now” button (happens right after the first connection)
The 4 figures and the chart
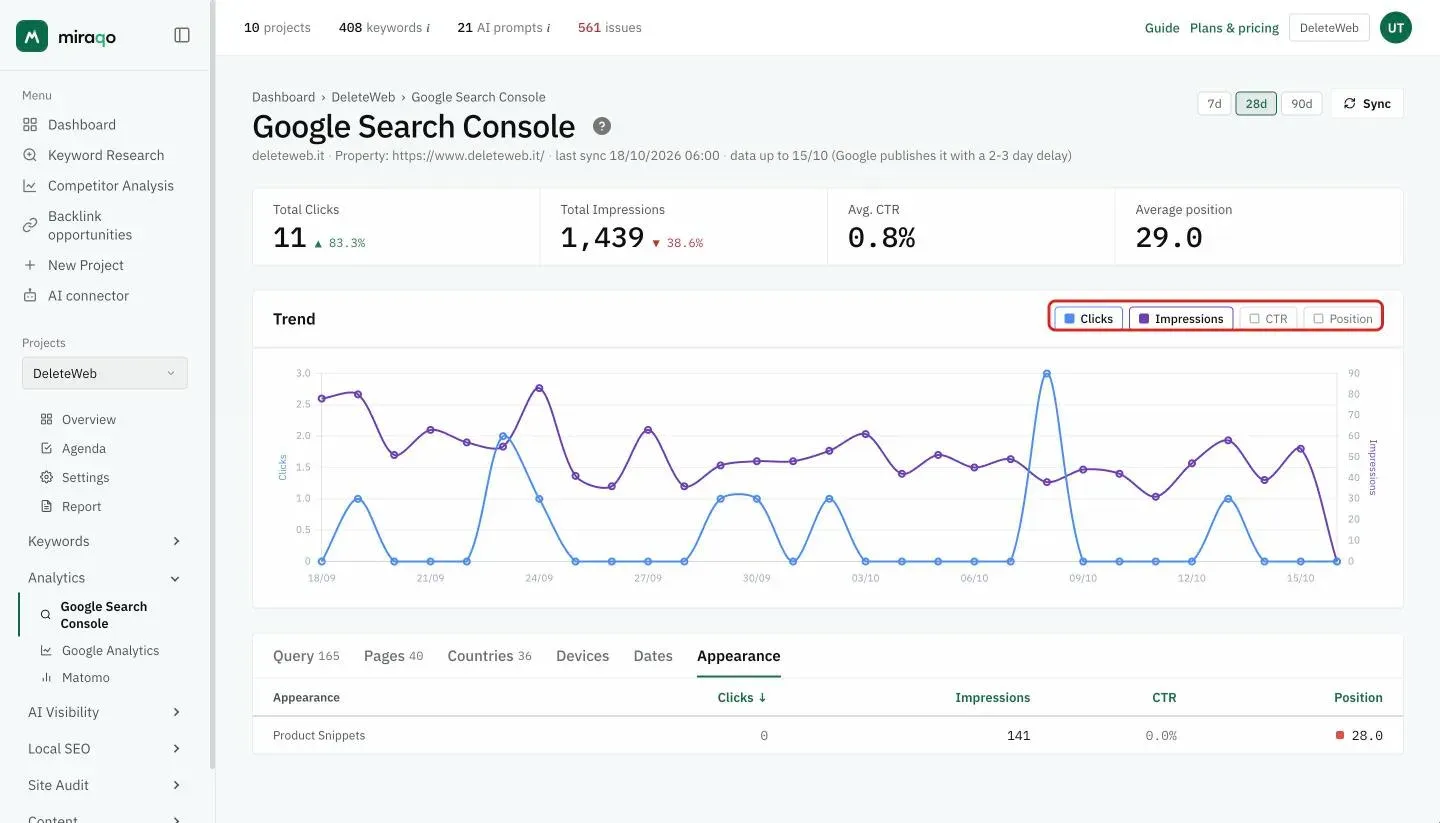
At the top, the value for the period with the percentage change (when comparable): Total Clicks, Total Impressions, Avg. CTR and Average position.
Below, the day-by-day Trend chart. The buttons top right turn the series on and off: Clicks and Impressions are on by default, CTR and Position off. The clicks axis is on the left, the impressions axis on the right.
The 6 tabs
Below the chart, tabs for exploring GSC data from different angles. The Queries, Pages and Countries tabs show next to the name how many rows they contain. All tables are sortable by clicking the column header.
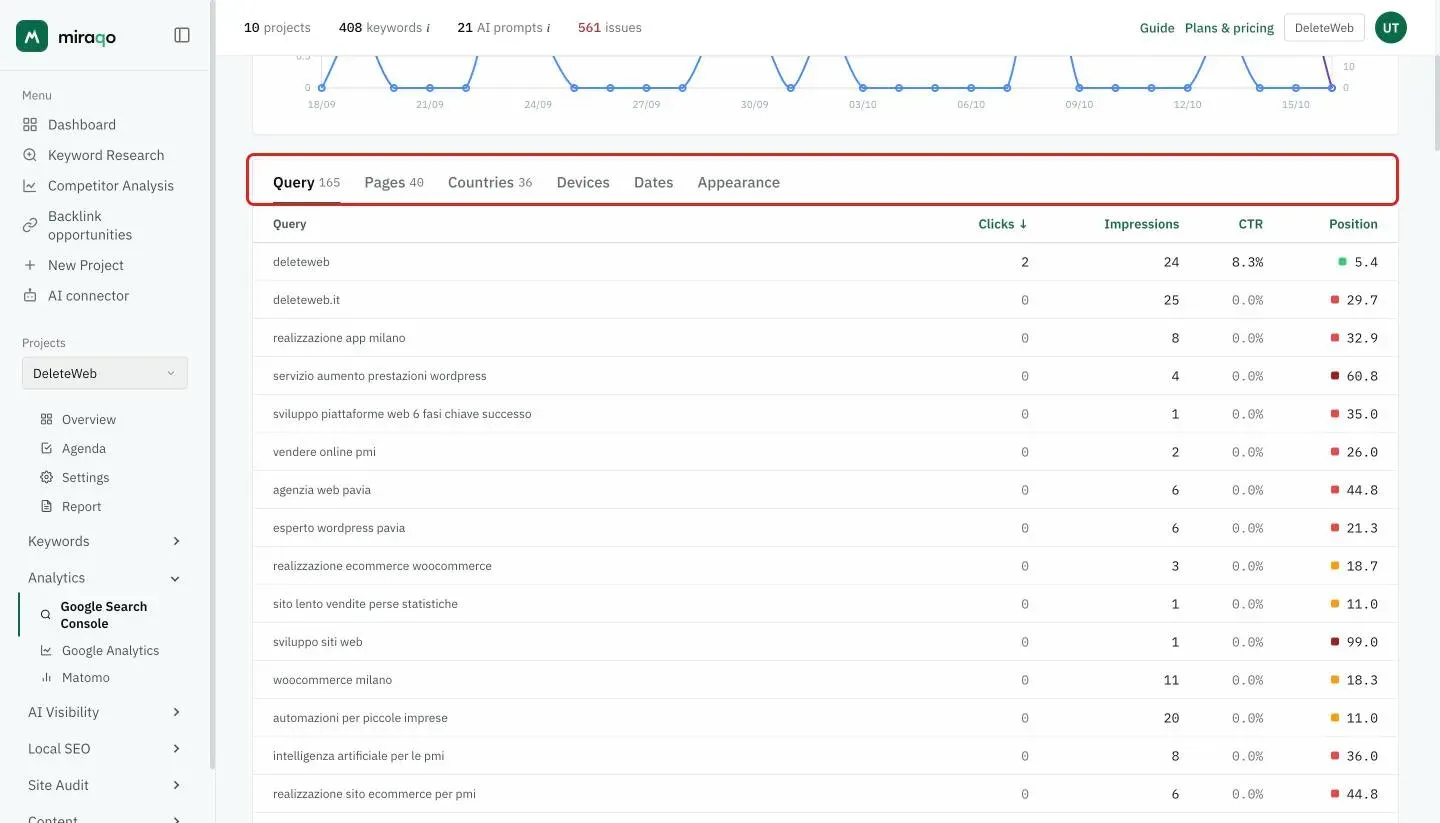
Queries
Query table with Clicks, Impressions, CTR and Position. CTR is the row’s clicks divided by impressions; next to the position there’s the coloured square of its band, the same as on the Rankings page.
Pages
Table of the site’s ranking URLs, with the same 4 metrics. Pages are linked (open in a new tab).
Countries
Distribution of organic traffic by country (with ISO code).
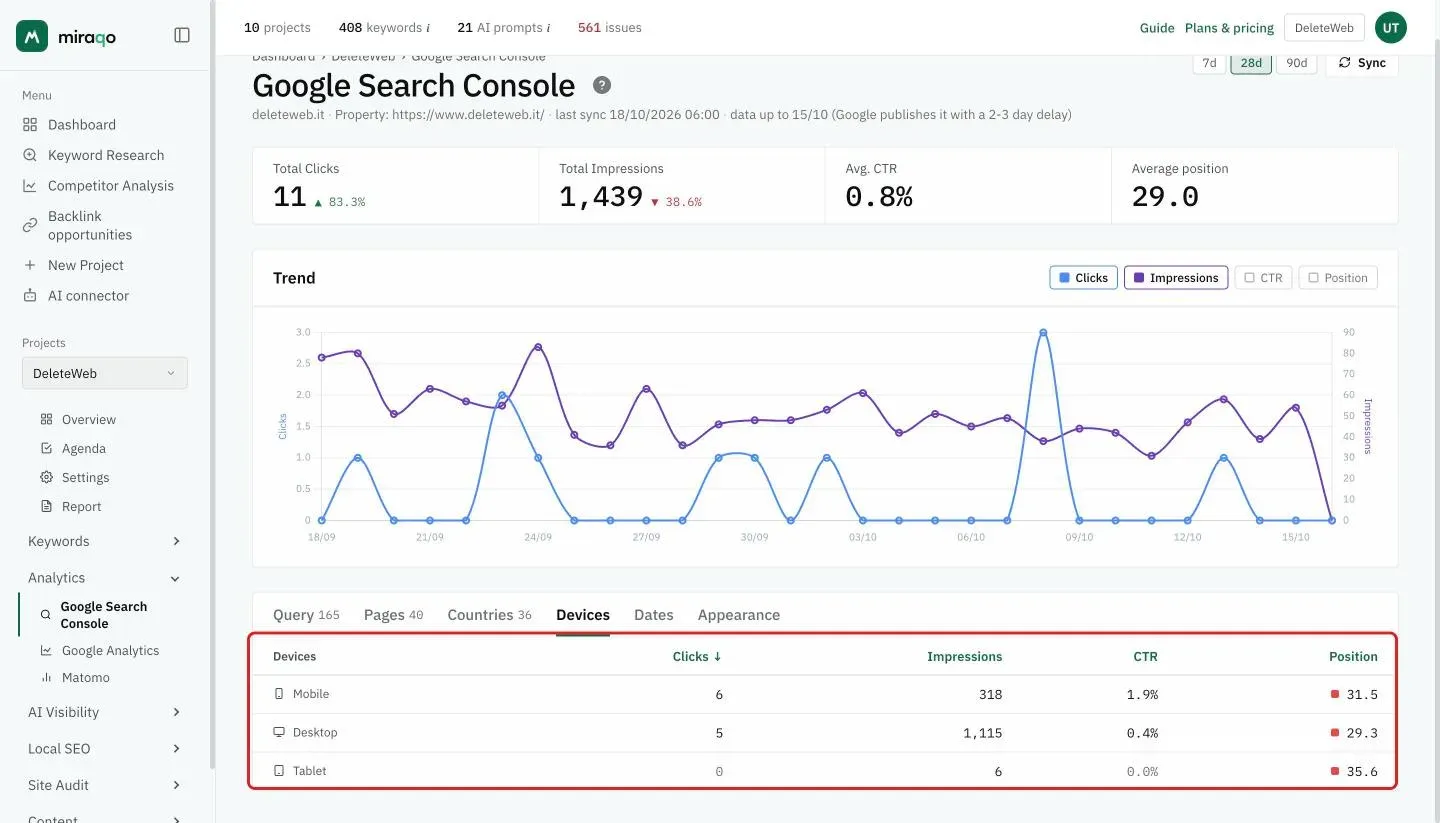
Devices
One row each for Desktop, Mobile and Tablet, with the same 4 metrics.
Dates
Day-by-day table (useful for manual export or investigating individual days).
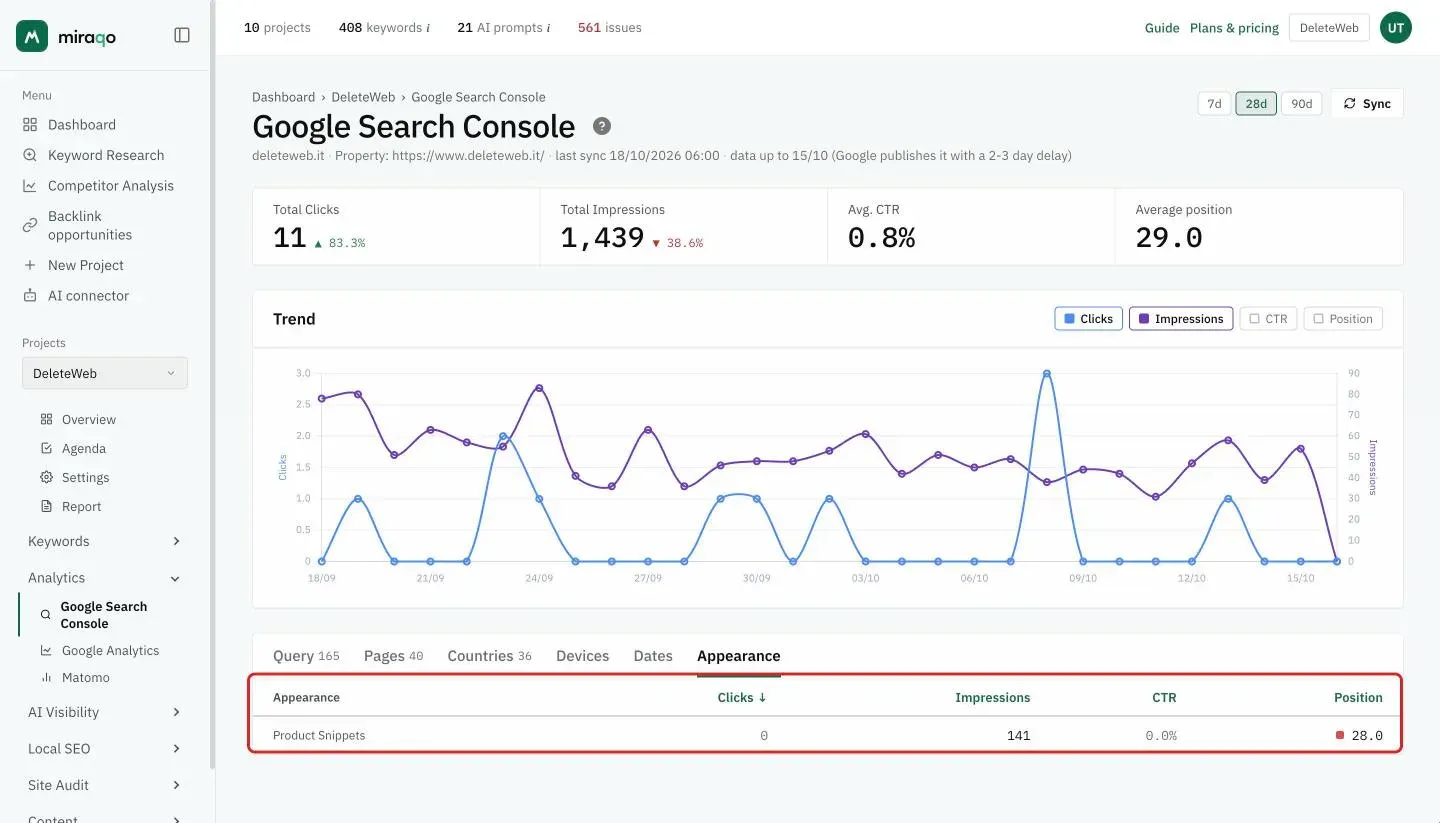
Appearance
Distribution by rich result type (Rich Results, Video, Images, FAQ, Review, Product Snippets, …), one row per type with the same 4 metrics. See which features Google is using to show your site in SERPs.
Synchronisation
Miraqo refreshes GSC data automatically every day over the full 90-day window. You can also force a manual sync with the Sync button at the top (consumption: 1 GSC API call per day, no dedicated plan limit).
Traffic drop alert. After each sync Miraqo compares clicks in the last 7 available days with the previous 7: if they fall by at least 30% and the comparison week had at least 50 clicks, whoever has the Drops box enabled in the project notifications gets an email, at most once a week.
Google data freshness. Search Console consolidates data with a 2–3 day delay. To avoid showing fictitious drops, the sparkline charts and percentage deltas on the Dashboard stop at the freshness boundary (approximately today − 2 days): the last 1–2 days not yet final are excluded from comparisons. It’s normal for the Dashboard not to show “yesterday”.
Disconnection
Settings → General → Google Search Console → Disconnect. Confirmation required. The history of already-imported data stays visible on the GSC Data page, but you won’t receive new updates until you reconnect.
You can also revoke access on Google’s side: Google Account → Security → Third-party apps. After revocation, the next sync will fail with invalid_grant (see below).
Common errors
- “invalid_grant” during sync — the token has been revoked (Google password change, expiry, manually revoked access or app removed from Google Account). Go to Settings → General, click Disconnect and reconnect.
- No properties appear in the selector — the Google account chosen doesn’t have access to any GSC property. Verify you’ve logged in with the correct account and, if needed, have the site owner add you as a user in GSC.
- Properties listed but no data — the property has been verified for less than 24–72h. Google takes 1–3 days to populate data for new properties.
- Sync OK but tables empty for a specific tab (e.g. Countries/Appearance) — your site hasn’t received traffic/impressions of that type yet, or GSC hasn’t aggregated enough data. This isn’t a tool bug.
What changes elsewhere after connecting
- Project overview — the “Key Metrics” card shows enriched data and the Analytics widget correlates better
- Triage dashboard — the ∆ GSC Impressions column appears and the 30-day click trend in the project row
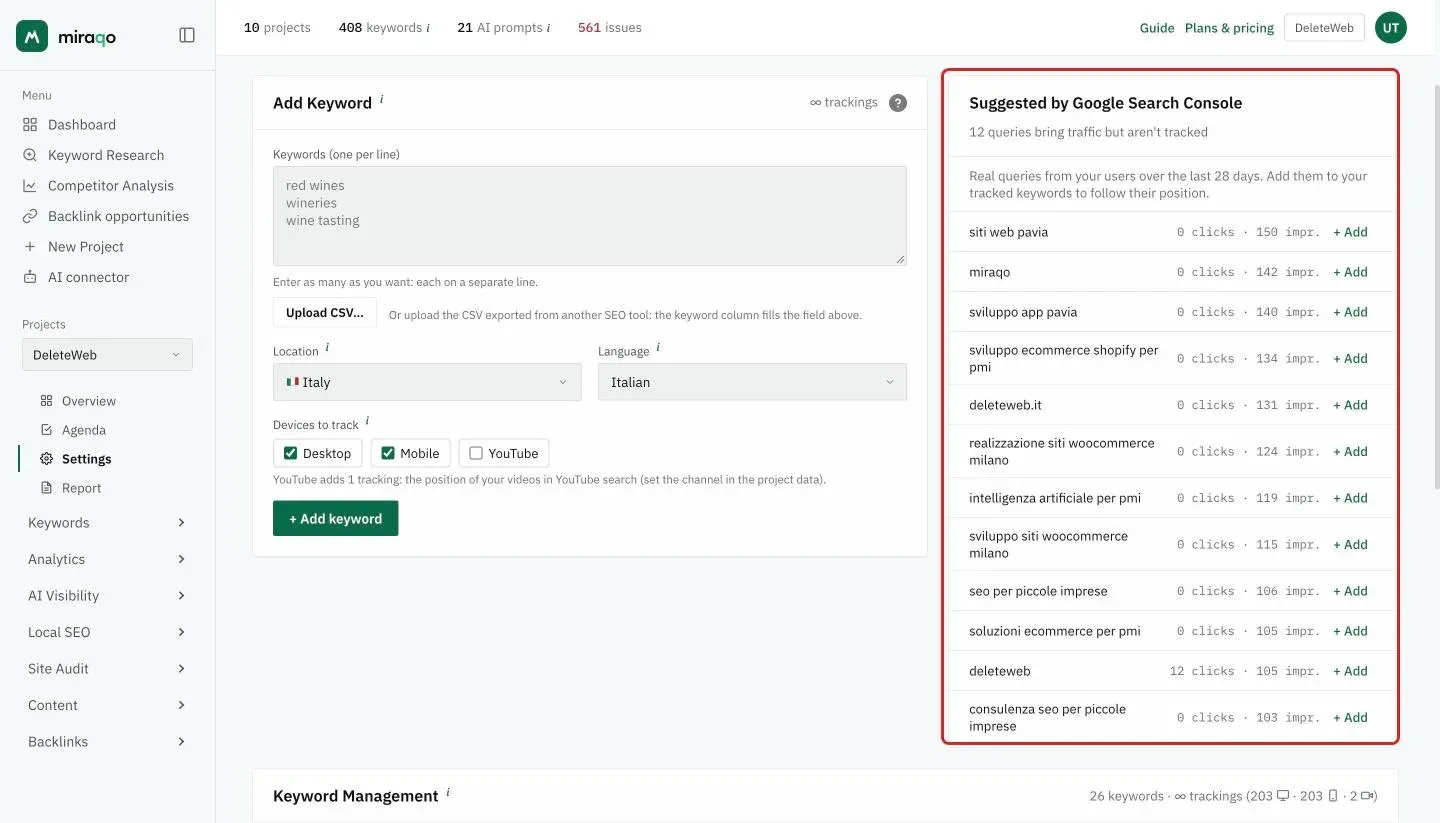
- Project keywords — in Settings → Keywords the “💡 Suggested by Google Search Console” panel appears with incoming queries to add to tracking (clicks and impressions from the last 28 days, + Add button per row)
- AI prompts — in Settings → AI Prompts a similar panel appears with multi-word queries from GSC as candidate prompts
Initial setup complete. You can now:
- Connect Google Analytics 4 or Matomo →
- Run your first SEO audit →
- Configure the local ranking map →
- Add AI Visibility prompts →
Last updated: 18 October 2026