Connect Google Analytics 4 or Matomo
How to connect GA4 (Google OAuth) or Matomo (URL + auth token) to a project and read the analytics dashboard — main figures, chart with series to switch on, secondary KPIs, Organic/All toggle, Daily/Landing/Conversions tabs and Channel/Country/Device/Browser breakdown.
Connecting an analytics provider is optional but very useful: it brings real traffic (sessions, users, engagement, conversions) alongside ranking data. You can connect Google Analytics 4 or Matomo — or both: each has its own dedicated dashboard under the Analytics group in the sidebar.
Both connections are managed from Settings → General, in the Connections card (the Google Analytics 4 and Matomo rows).
Connecting Google Analytics 4
-
Open the project → Settings → General.
-
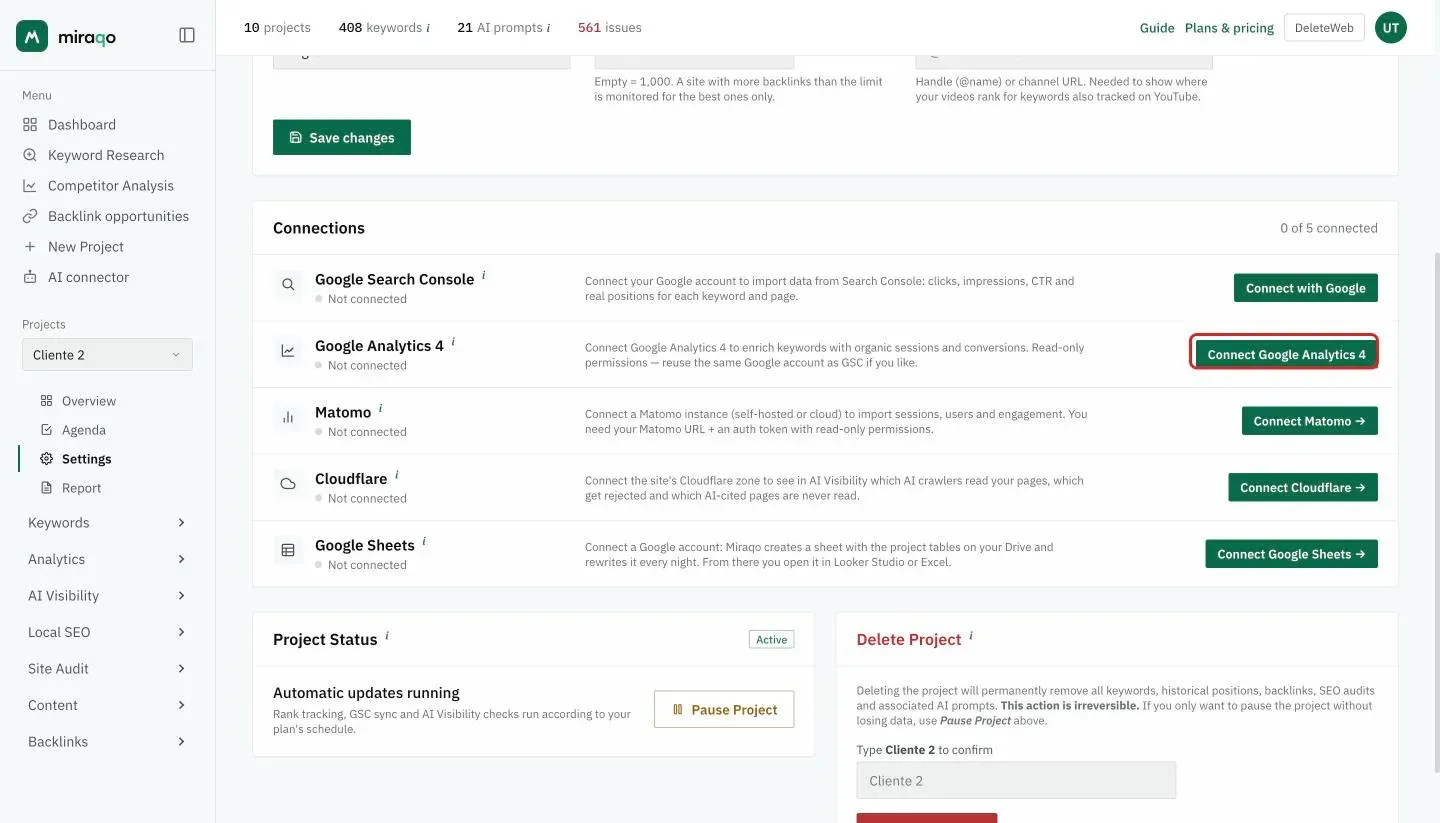
In the Connections card, on the Google Analytics 4 row, click Connect Google Analytics 4.
-
You’re redirected to Google: choose the account with access to the GA4 property and grant permissions (read-only: Miraqo writes nothing to Analytics).
-
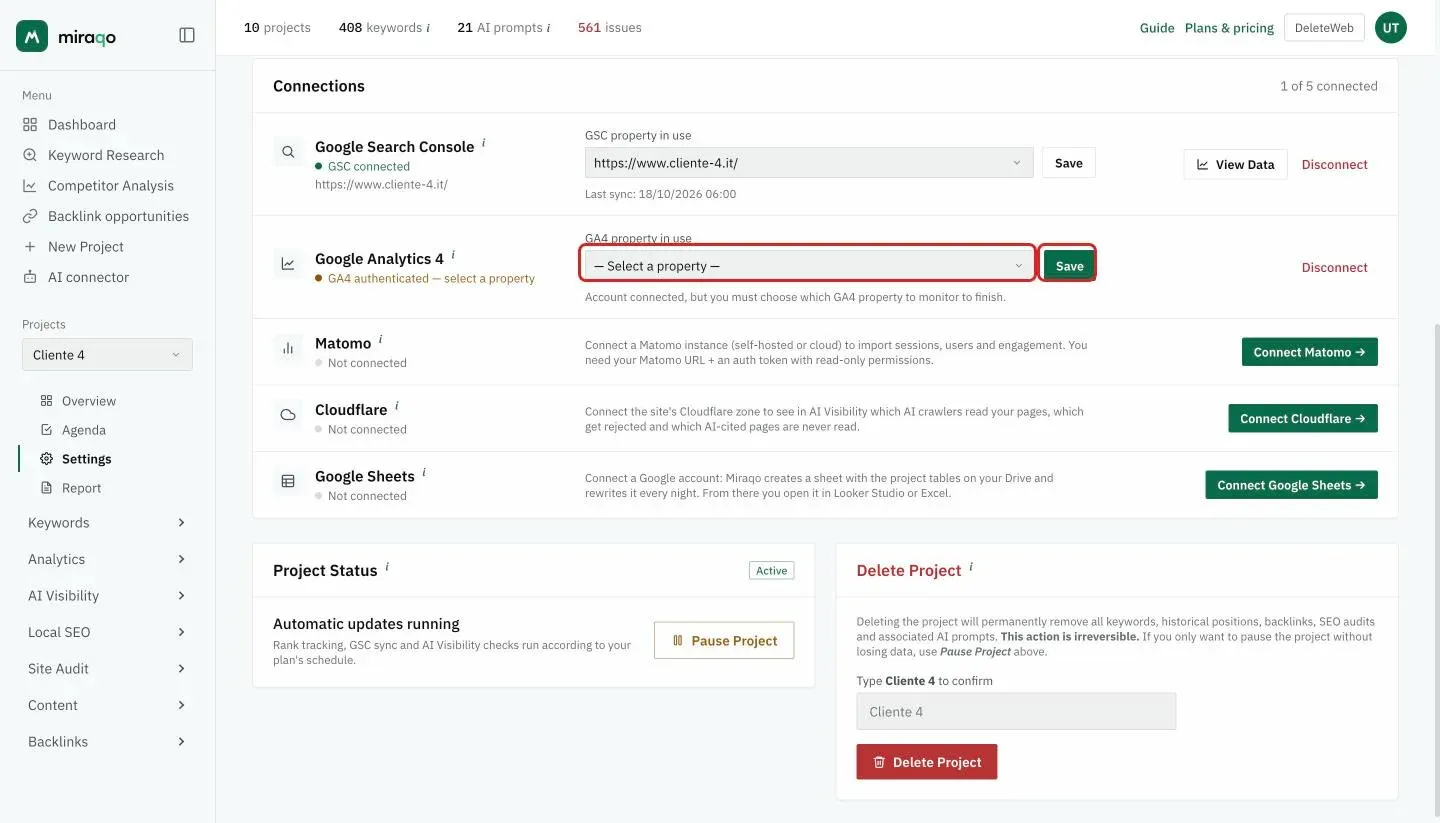
Back on Miraqo. If your GA4 property uniquely matches the project’s domain, it’s selected automatically. Otherwise the status «GA4 authenticated — select a property» appears with the GA4 property in use dropdown to choose it manually: select it and click Save.
-
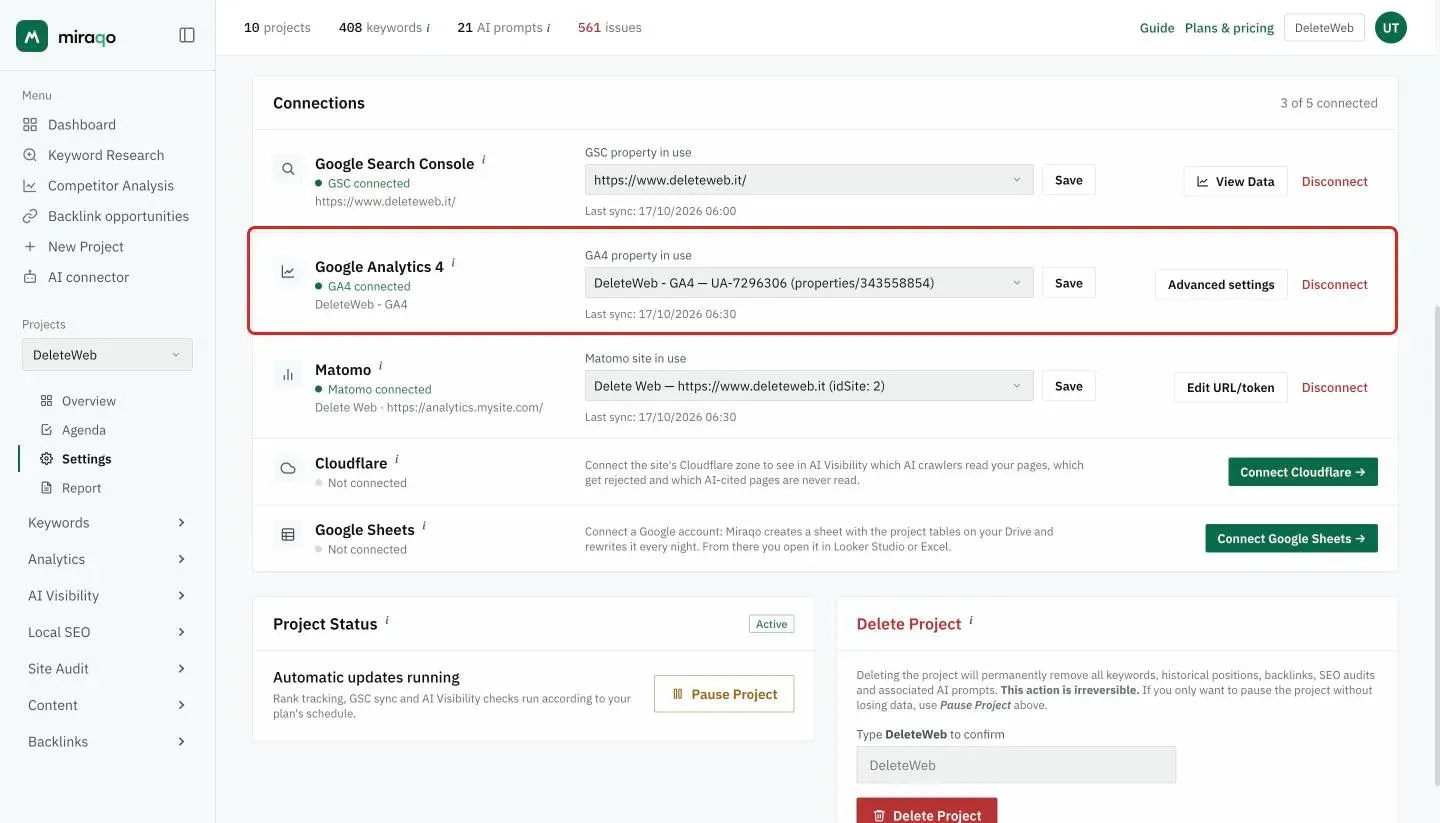
Once connected, the row shows GA4 connected with the property name, the last sync date and the Advanced settings and Disconnect buttons.
-
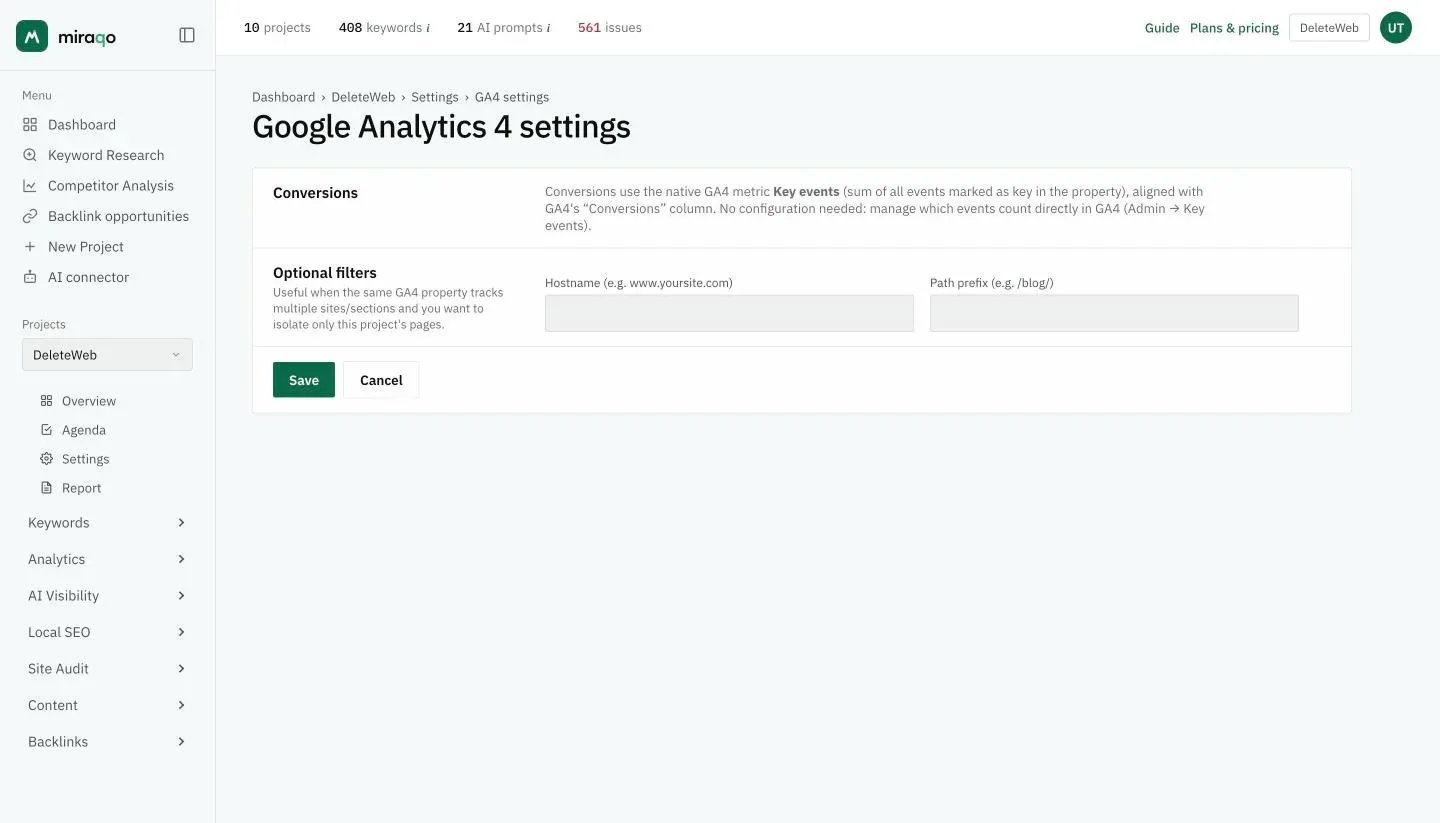
Click Advanced settings on the GA4 row to open the fine-tuning page (optional):
- Conversions — no configuration needed: Miraqo reads the property’s native Key events, the same metric as GA4’s “Conversions” column. Decide which events count directly in GA4 (Admin → Key events).
- Hostname / Path prefix filters — useful when the same GA4 property tracks multiple sites or sections and you want to isolate only the pages for this project.
Changing property after connecting. From the GA4 row in Settings, if you have multiple properties available on the account, you can change the property from the dropdown without reconnecting.
Connecting Matomo
- Open the project → Settings → General.
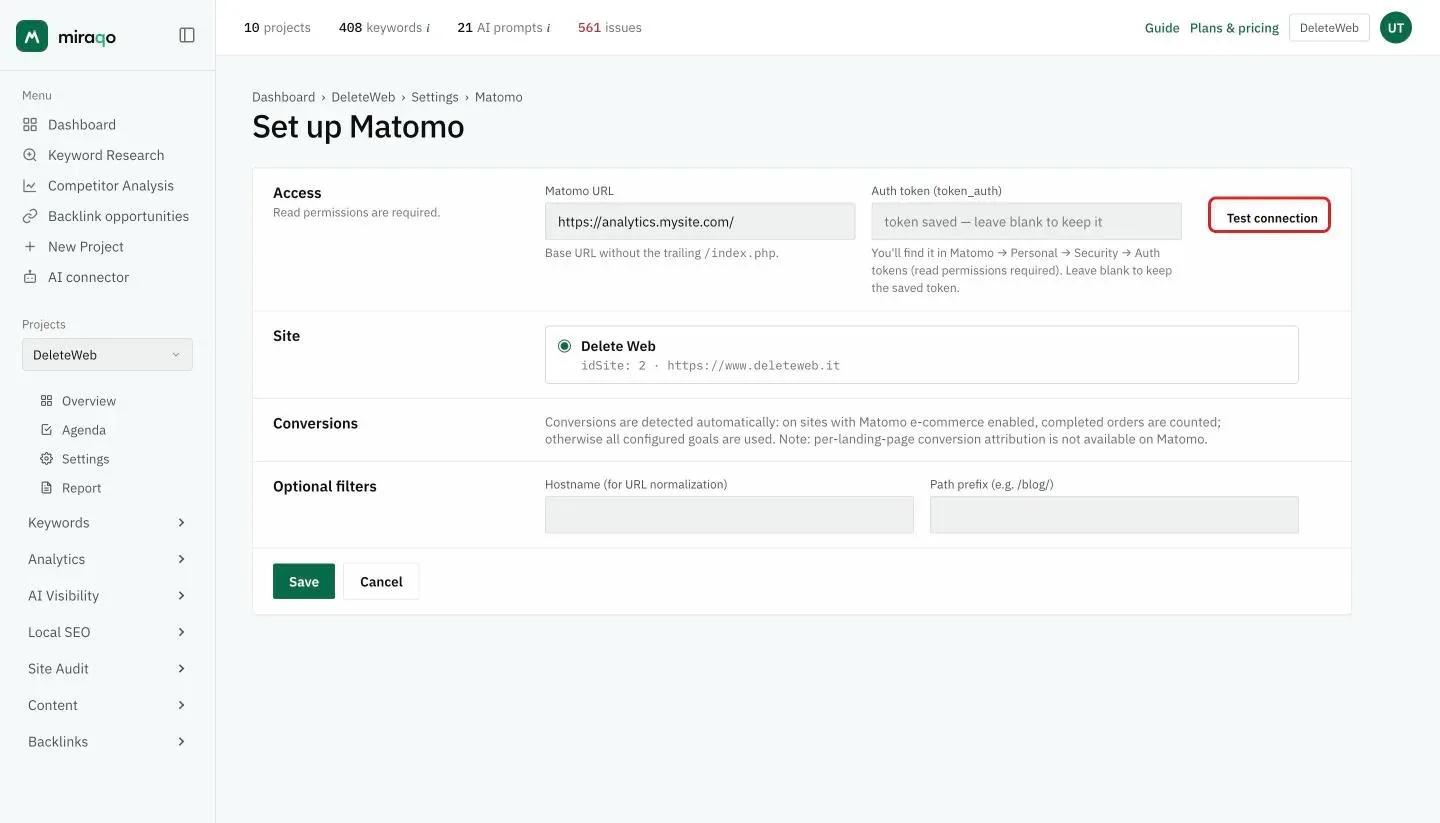
- In the Connections card, on the Matomo row, click Connect Matomo →.
- Enter the Matomo URL — base URL, without a trailing
/index.php(e.g.https://analytics.mysite.com). - Enter the Auth token (
token_auth). Find it in Matomo → Personal → Security → Auth tokens; you need read-only permissions on the site. - Click Test connection: if the credentials are valid, the site list appears. Select the site (idSite) to monitor.
- Conversions are detected automatically: on sites with Matomo e-commerce active, completed orders count; otherwise all configured goals (Goals) count. Conversion attribution per individual landing page is not available on Matomo (total conversions remain correct and visible in the cards and the Conversions tab).
- (Optional) Hostname / Path prefix filters as for GA4.
- Save.
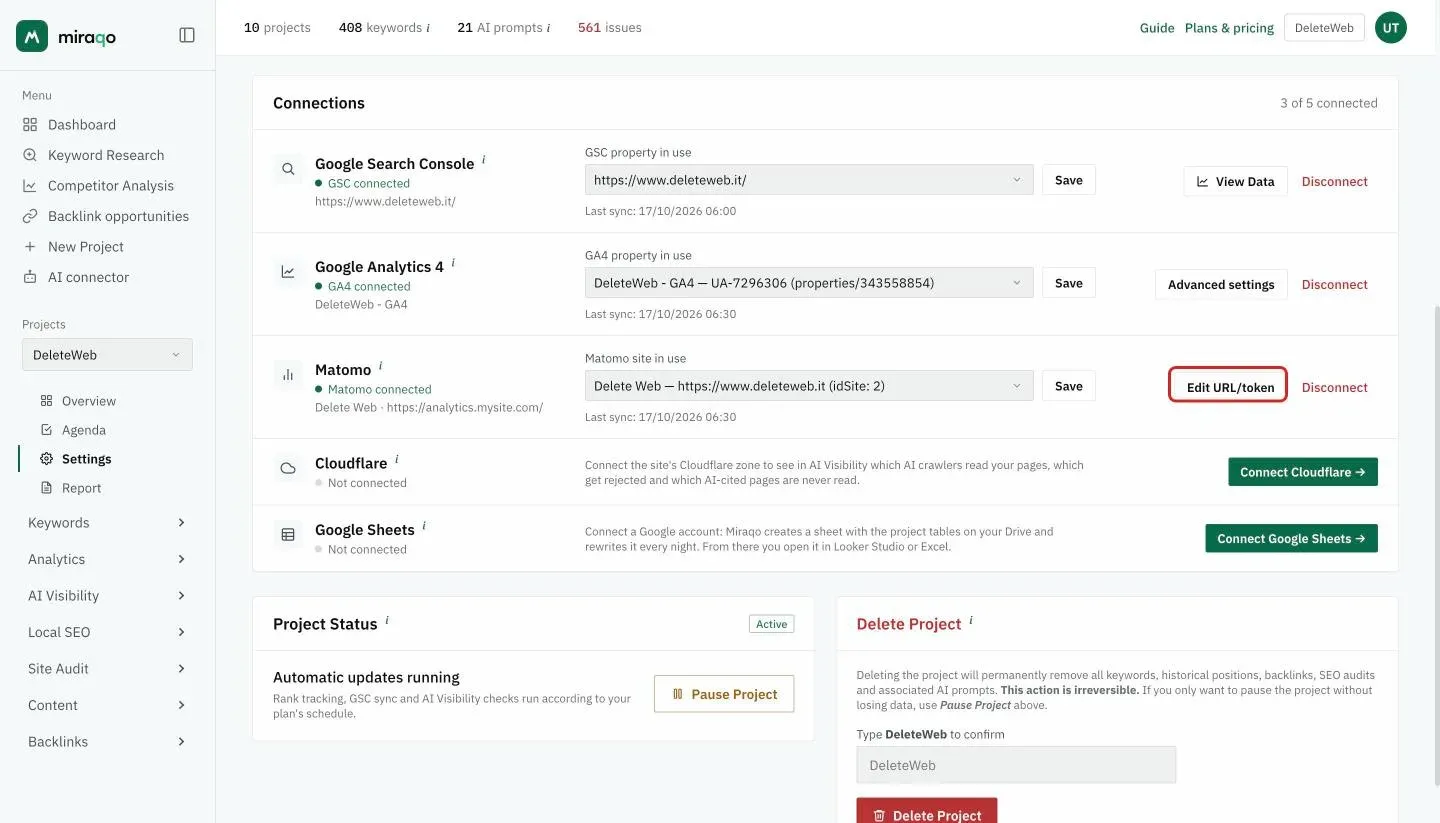
From the Matomo row in Settings you can also click Edit URL/token to change credentials without disconnecting, and change the site from the dropdown if the instance exposes more than one site.
The Analytics dashboard (GA4 or Matomo)
GA4 and Matomo use the same dashboard page, with the same layout: only the provider label at the top changes (and some data derived from differences between the two platforms).
Header and actions
- Title “Google Analytics 4” / “Matomo”; below it, the domain, the property (or Matomo site) and the time of the last sync
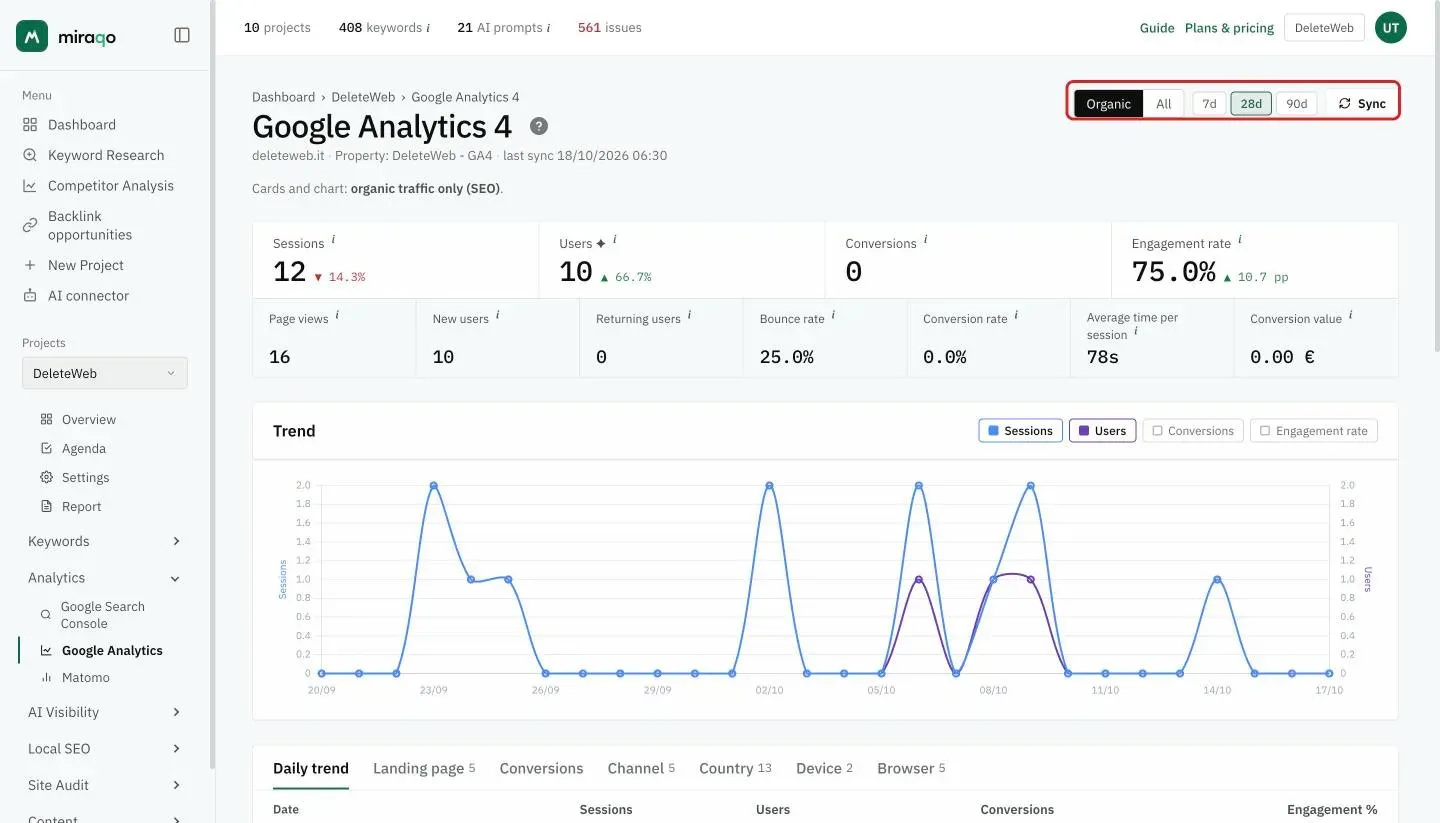
- Top right, from the left:
- Organic / All — filters the figures and the chart between organic-only (SEO) traffic and all traffic; the line below the title reminds you which one you’re looking at. The Landing page table always shows organic traffic, regardless of this choice.
- 7d · 28d · 90d — the period
- Sync — forces a data refresh (for roles with sync permission)
Pre-data states
- Not connected — empty state with Settings link
- Incomplete connection — missing URL/token (Matomo) or authorisation/property (GA4)
- Backfill in progress — hourglass overlay “Preparing data…” that blocks the chart until the async history is complete (the page updates itself via polling, may take 1–2 minutes)
The 4 main figures and the chart
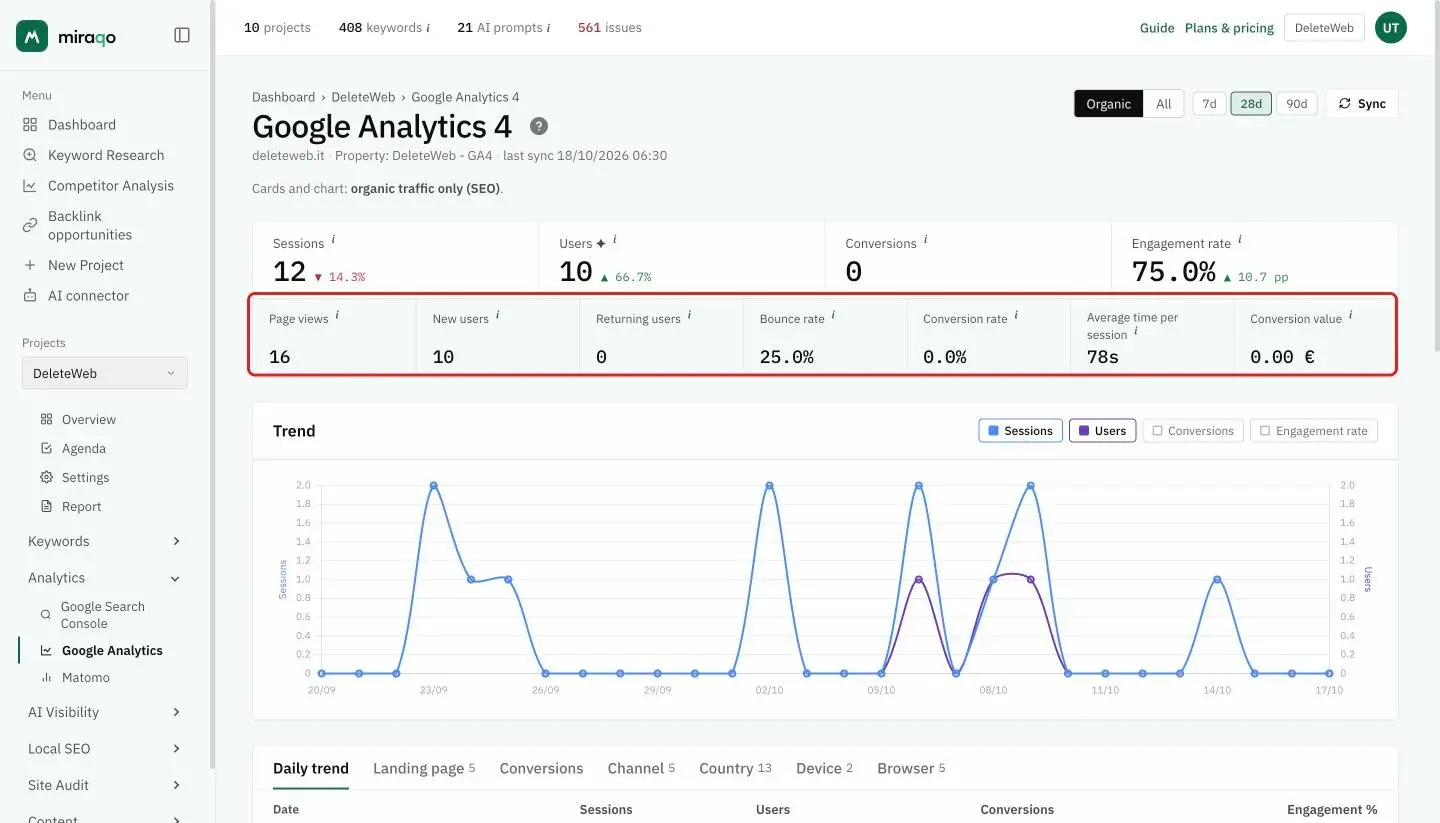
At the top, four figures for the period:
- Sessions — sessions in the period
- Users — unique users in the period. The ✦ symbol next to the number indicates the provider returns the value already deduplicated for the period (no approximation)
- Conversions — key events configured (GA4) or completion of the linked objective (Matomo)
- Engagement rate — % “engaged” sessions (with dwell time, conversion or more page views). Variation is in pp (percentage points)
Each figure shows the total value and the change compared to the previous period of equal duration.
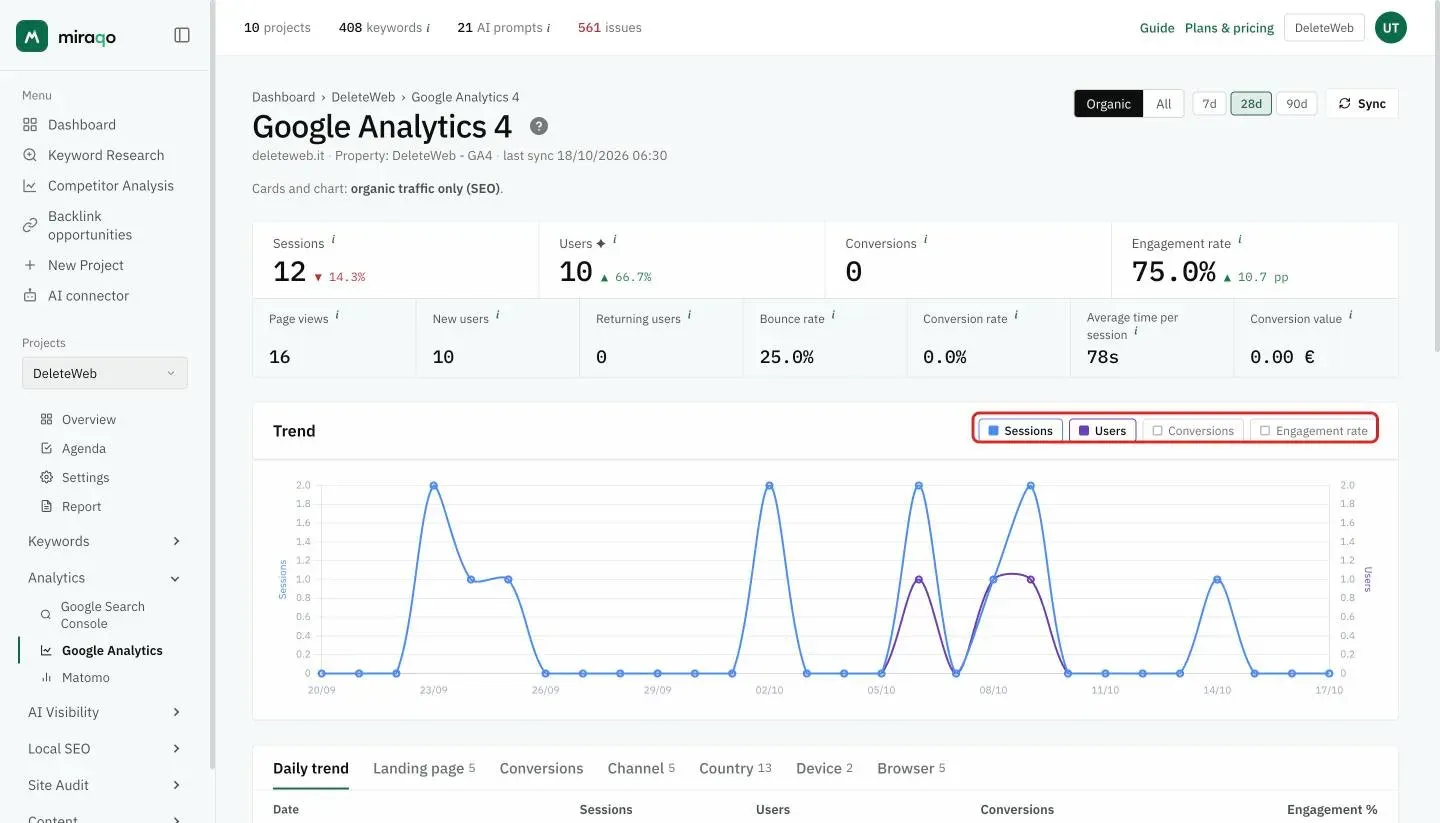
In the Trend chart, the buttons top right turn the series on and off: Sessions and Users are on by default, Conversions and Engagement rate off.
Secondary KPIs (7 figures)
Below the four main figures, a row of seven smaller figures:
- Page views — total page views
- New users
- Returning users
- Bounce rate — % non-engaged sessions (inverse of engagement)
- Conversion rate — conversions / sessions
- Average time per session — total engagement time divided by the sessions in the period (GA4 divides it by user, so there the number is higher)
- Conversion value — monetary value in the property’s currency (Total revenue on GA4, goal value on Matomo)
Tabs
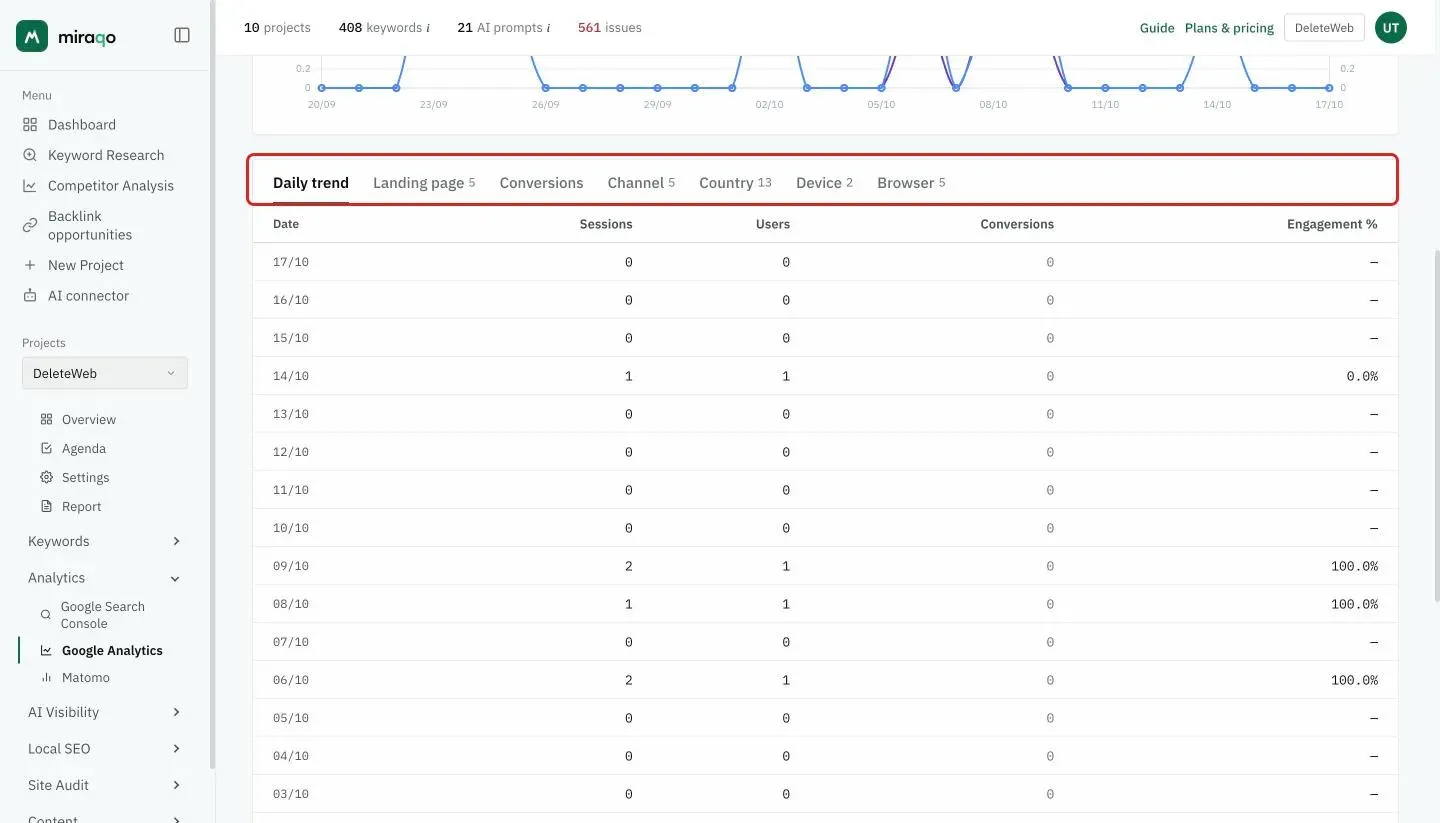
Below the chart, the tabs for exploring the data, each with the number of rows next to it. Tables sort by clicking the header.
Daily trend
One row per day: Sessions · Users · Conversions · Engagement %.
Landing page
The most visited entry pages from organic traffic (the tab doesn’t respect the All/Organic toggle). Sortable by Sessions / Users / Engagement % / Conversions.
Conversions
Total conversions, economic value and conversion rate for the period.
Breakdown — Channel / Country / Device / Browser
Additional tabs, one per dimension. The breakdown history populates from the first daily sync after connection: there’s no retroactive backfill for these dimensions, so data starts from the connection date (it’s normal for them to be empty the first day).
Synchronisation
- Automatic initial backfill — as soon as you connect, Miraqo imports the last 90 days in the background. For large projects this may take a few minutes. During the backfill, the dashboard shows the hourglass overlay described above.
- Daily sync — automatic, refreshes with a window that recovers data providers consolidate with a delay.
- Sync — manual button in the header to force a refresh.
Disconnection
Settings → General → Disconnect button in the GA4 or Matomo row (with confirmation). The history already imported stays visible in the dashboard, but you won’t receive new updates until you reconnect.
For GA4 you can also revoke access on Google’s side: Google Account → Security → Third-party apps. After revocation, the next sync will fail with an authorisation error: go back to Settings and reconnect.
Common errors
- “GA4 authenticated — select a property” doesn’t complete — you granted access but haven’t yet chosen the property from the dropdown. Go back to Settings and select it.
- Matomo: “Test connection” fails — check that the URL is the base one (without
/index.php) and that the auth token has read permissions on the site. - No property/site in the list — the Google account or auth token used doesn’t have access to any GA4 property / Matomo site. Use credentials with the correct permissions.
- Conversions at zero — on GA4 the property has no Key events configured (set them up in GA4, Admin → Key events); on Matomo there are no Goals nor active e-commerce.
- Breakdowns empty right after connecting — normal, they populate from the next daily sync (no retroactive backfill for dimensions).
- Dashboard stuck on “Preparing data…” for more than 5 minutes — a backfill sync failed. Disconnect and reconnect, or contact support.
What changes elsewhere after connecting
- Project overview — the Analytics widget shows a summary card for each connected provider, with a sessions/day chart
- Project keywords — the Sessions and Conv. rate columns appear in the Keyword Detail table, associated with the main landing page of each keyword
- Triage dashboard — the GSC click trend remains primary, but analytics data enriches the reports
Next steps:
Last updated: 18 October 2026